
Arabidopsis Genome Maps
Sequences from US Patents Mapped onto the Chromosomes of Arabidopsis
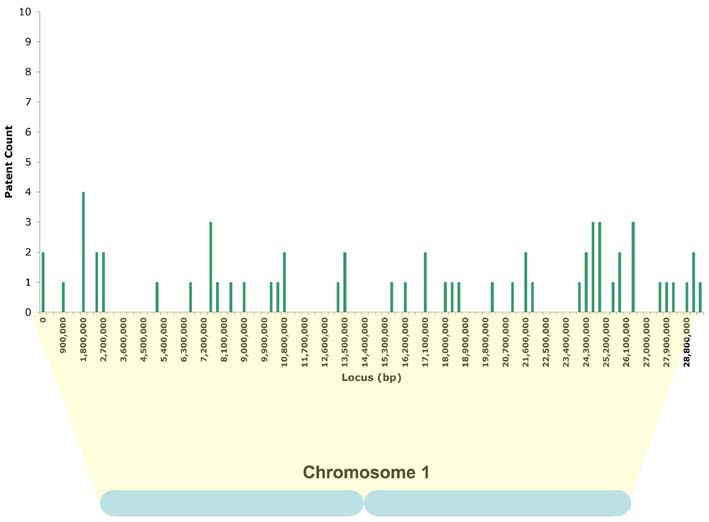 |
By performing a modification of the analysis of Jensen and Murray (Science. 2005 Oct 14;310(5746):239-40.), a member of our group was able to map patented sequences from US granted patents onto the Arabidopsis chromosomes. The following 5 maps demonstrate the distribution of patents across Arabidopsischromosomes.
Note carefully the limitations of this analysis:
(see below for more details of these analyses) (Chromosome 1 = 30Mb) |
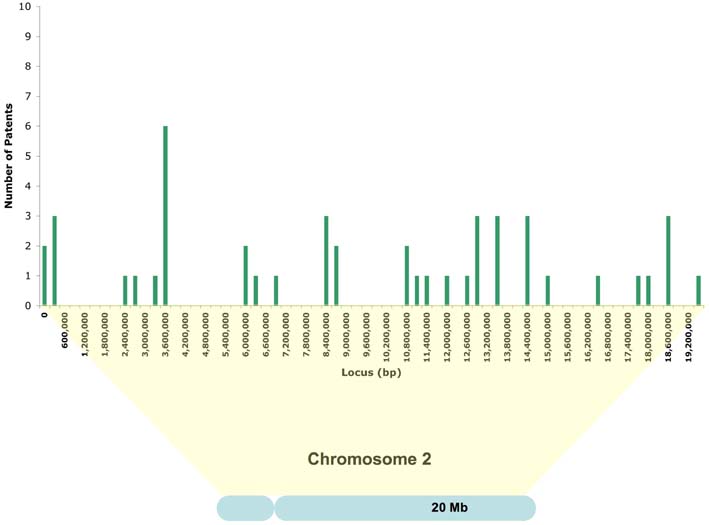 |
In all chromsome maps the Y-axis is the number of patents found within 300Kb sections of the chromosome map.
Chromosome 2 |
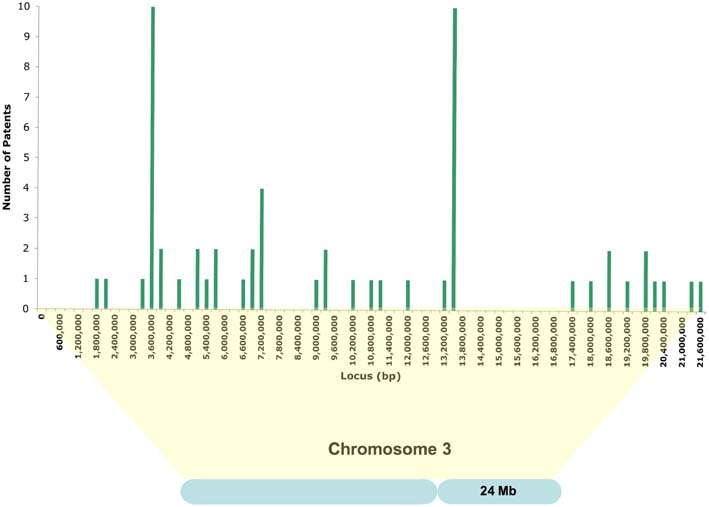 |
Chromosome 3:
Note:
|
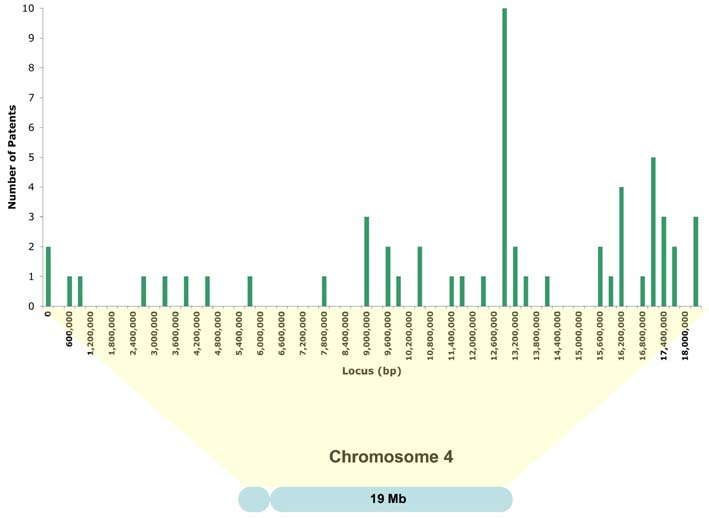 |
Chromosome 4
Note: Sequences contained in US applications were not included in any of these chromosome maps. All of the bulk sequence applications discussed in the text below are not included in this map. |
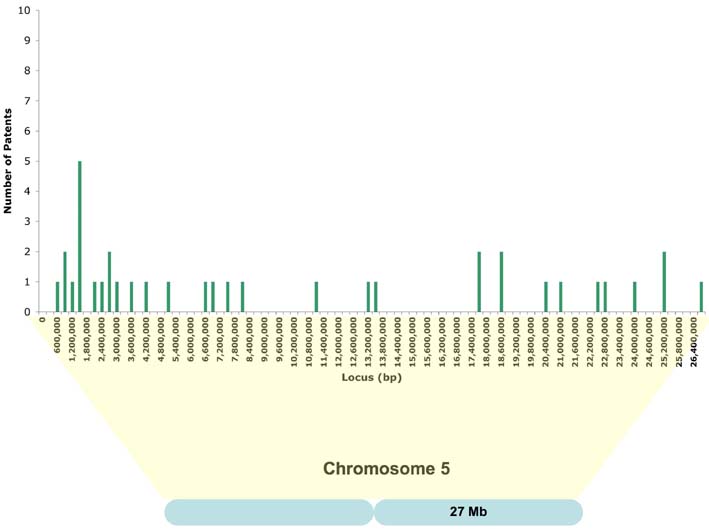 |
Chromosome 5
The same Y-axis scale has been used throughout, to allow the user to compare the relative “intensities” of patenting activity on each of the chromosomes. Different X-axis scales have been used, to allow optimal resolution of patent activity. The relative sizes of the different chromosomes are represented in the chromosome graphic below the X-axis. |
|
Note: Because of the nature of the analysis above (see the notes on the right of the maps above), the mapped sequences are likely to greatly under-represent the true degree of patent activity on theArabidopsis genome! |
|---|
The in